


Anxious Markets


Market Perspective from Mark R. Shenkman, October 2021
All good times must come to an end. The September stock sell-off was inevitable as investors reacted to a myriad of negative trends. The equity markets experienced their worst September monthly return since 2011. Supply chain disruptions, labor shortages, soaring energy and food prices, higher shipping costs, and surging inflation are rattling investor sentiment, which could derail the post-pandemic economic recovery. The greatest threat to the global economy and markets is that the rising flames of inflation may be difficult to contain. On top of these mounting concerns, the acrimonious political environment over lifting the U.S. debt ceiling and the staggering cost of new social spending programs could further destabilize the markets. Meanwhile, the Federal Reserve has been more aggressive in signaling the need to transition away from asset purchases to focus on hiking interest rates, thereby risking corporate profits and GDP growth. Surprisingly, the leveraged finance markets have weathered the tumult in the stock market as credit investors have a different perspective than equity investors. Clearly, there are reasons to be anxious!
TRENDING TOPICS
The high standard of living in the U.S. has been driven by low-cost borrowing over the last 20 years. While we read much about the raising of the U.S. debt ceiling to levels deemed “unsustainable,” an often-overlooked metric is the cost of borrowing. According to the CBO, interest payments over the next three years will be the lowest since the 1960s, relative to the size of the U.S. economy. In other words, the extra debt incurred is outweighed by the decline in borrowing costs. Treasury yields across all maturities would need to average 2.5% to reverse this trend, yet the average was below 1.6% in August, the lowest in more than 20 years.
Concurrently, the floating U.S. dollar remains the top currency for trade and finance as well as international reserve, which has helped the U.S. to consume more of the world’s resources than it produces. Hence, international demand for U.S. dollars has financed the difference.
With the Fed seemingly intent on tapering its bond purchases, the expectation would be for rising rates to follow. At present, the Fed purchases 60% of all U.S. Treasury offerings, but foreign ownership of U.S. debt instruments has also risen in recent months. The August Treasury auction showed over 25% was purchased by foreign governments (primarily Japan and China), a theme that should persist as U.S. debt offers favorable liquidity and yields versus peers in Europe and Asia.
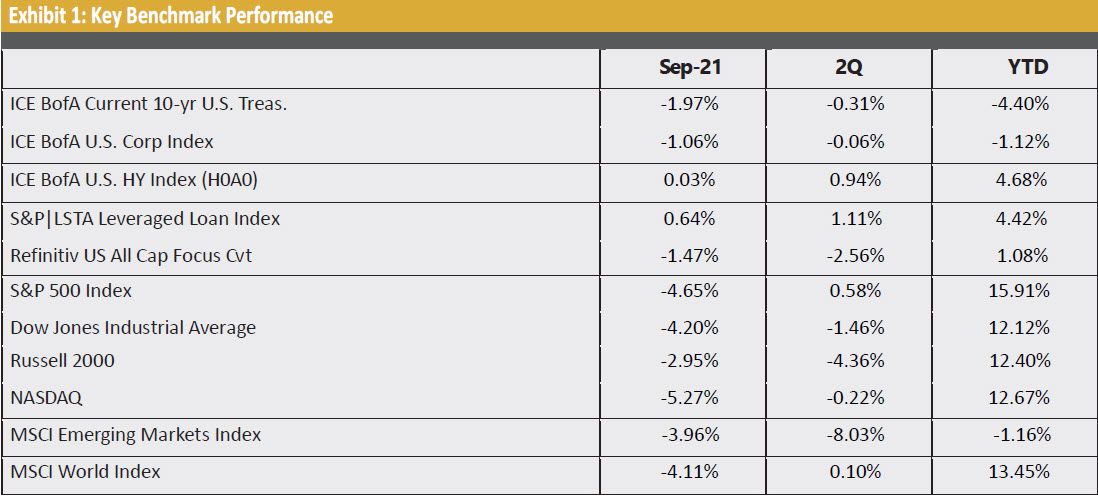
Exhibit 1 illustrates performance for various indices in September, Q3, and YTD.
ECONOMIC UPDATE
After nearly a year and a half of red-hot, reopening-driven growth, several U.S. economic indicators are showing signs of leveling off as headwinds continue to build.
One of the most obvious hindrances has been the clogged supply chain. In Southern California, home to the ports of entry for roughly half of all imports, more than 60 cargo ships are waiting to off-load. When they do finally dock, unload times have risen from 3.6 to 6.4 days; almost five days longer than ports in Asia. According to RBC Capital Markets, ships are carrying 30% more goods but are unloaded by 28% fewer people, exacerbating the problem.
Despite the supply chain woes, U.S. factory growth unexpectedly expanded in September with the ISM manufacturing index rising to a four-month high of 61.1 from 59.9 in August. Inflation concerns seem well- founded as the Fed’s preferred inflation gauge, personal consumption expenditures (PCE), rose 4.3% in the year ended August. The gain, which represented the largest annual increase since 1991, was largely driven by outlays for food and household supplies.
The housing market in the U.S. has been transformed by the pandemic. Low borrowing costs and thin inventory pushed prices steadily higher, with the median existing home selling price increasing 14.9% to $356,700 in the year ended August, according to the National Association of Realtors. The increase has priced out many first- time home buyers, which represented just 29% of August sales.
While home buyers have struggled to keep pace with rising home prices, the increase has been a key component of household net worth, which rose by $5.8 trillion, or 4.3%, to $141.7 trillion, hitting a new record in the second quarter, according to the Federal Reserve. Household real estate holdings boosted the figure by $1.2 trillion, while surging equity valuations contributed $3.5 trillion.
HIGH YIELD MARKET
Despite a sharp sell-off in the equity markets, high yield bonds showed a modest positive return in September, marking the twelfth consecutive monthly gain for the asset class. The average of the five major high yield indices rose 0.03% for the month to close the third quarter with a gain of 0.85%, and bringing the year-to-date return to 4.65%.
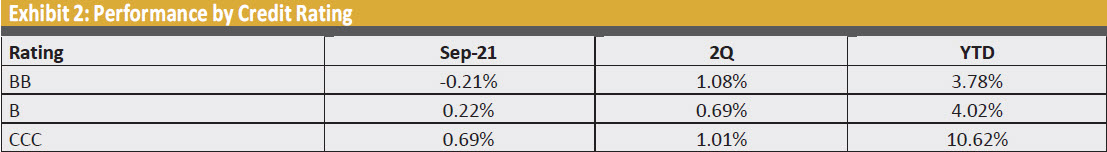
Returns by rating showed a clear risk-on bias in September, with CCCs posting a gain of 0.69% while BBs, hindered by a spike in interest rates, were modestly negative. On a year-to-date basis, CCCs continued to maintain a substantial performance advantage.
Exhibit 2 highlights performance by rating for the ICE BofA U.S. High Yield Index (H0A0).
New issuance in the high yield bond market rebounded in September with $43.7 billion coming to market, marking the highest level in four months following a seasonal summer slowdown. According to J.P. Morgan Research, $409.7 billion has been issued year-to-date, representing a 17% increase over the same period last year.
An important factor in the vibrancy of the high yield market is its ability to attract new issuers. Year-to-date, over 25% of new bond issuance has been from first-time issuers in the high yield market, helping to keep the asset class well-diversified and attractive to a widening global investor base.
The leveraged loan market posted its strongest monthly gain since January, helped by rising interest rates, benign defaults, and record CLO issuance. The S&P|LSTA Leveraged Loan Index rose 0.64% in September, closing the quarter with a gain of 1.11%, and bringing the year-to-date return to 4.42%.
Issuance in the leveraged loan market totaled $54.4 billion gross and $38.0 billion net in September, according to J.P. Morgan Research. The loan market has absorbed $655.5 billion gross and $284.3 billion net year-to-date, representing increases of 110% and 138% year-over-year.
MARKET OUTLOOK
The waves of the market tide are now hitting the sea wall as investors confront several looming questions: Is inflation transitory or permanent? Can the Federal Reserve pace the tapering program to avoid jarring the markets? Can corporate profits remain at high levels with a persistent mismatch between rising consumer demand and lack of supply?
Americans may experience the worst buying conditions in many decades due to chronic labor shortages in key industries, oil prices possibly topping $100/bbl, surging food prices, and a housing market that is increasingly pricing out some potential buyers. As consumers may be forced to retrench in light of inflationary pressures, corporate profits could be challenged in 2022.
The intense U.S. budget battle over the $3.5 trillion spending package may have major ramifications on the markets if passed in its current form. Investors may need to re-calibrate their portfolio strategies in light of proposed tax changes.
The equity markets seem more vulnerable to rising interest rates given their spectacular returns since March 2020. Over the past 20 years, equity prices and bond yields have been highly correlated, but a de-coupling of the two asset classes may occur as Treasury yields rise. The high yield bond and loan markets held up better than expected during the September market rout because of the low default environment, and a global diversified investor base that is hungry for yield. These demand forces should remain in place for the foreseeable future.
Overall, the leveraged finance markets should be able to withstand the expected volatility in the equity and investment grade markets as the global economy and central banks enter an era of transition and uncertainty.
Legal Notices & Disclosures
All charts and data are for illustrative purposes only.
Views expressed herein are drawn from commentary provided to Harbor by the subadviser, Shenkman Capital Management, Inc., and may not be reflective of their current opinions or future actions, are subject to change without prior notice, and should not be considered investment advice. The information provided in this presentation is for informational purposes only.
The information provided in this article should not be considered as a recommendation to purchase or sell a particular security. The weightings, holdings, industries, sectors, and countries mentioned may change at any time and may not represent current or future investments. Performance data shown represents past performance and is no guarantee of future results.
Shenkman is an independent subadvisor to a Harbor Fund.
*Redistributed with Shenkman permission.

Locate Your Harbor Consultant
INSTITUTIONAL INVESTORS ONLY: Please enter your zip code to locate an Investment Consultant.