


Growth Rotation: Darlings or Duds?


.webp)
Executive Summary:
- Valuations for growth stocks have corrected due to higher rates, a rotation into value as Omicron leads to an endemic phase, and deceleration in growth rates as demand was pulled forward into 2020 and early 2021
- Valuations have become much more compelling, and forward return prospects appealing
- Higher real rates remain a risk to multiples near-term, though most of the de-rating is behind us
- Fundamentals remain strong and current valuation levels present a very attractive entry point to the disruption space
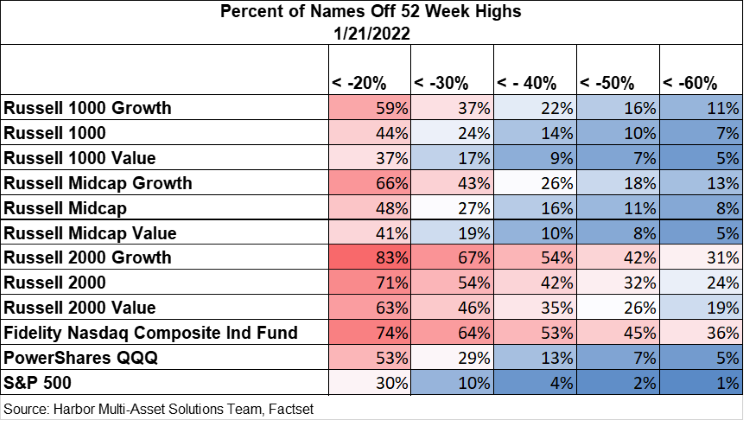
Over the past couple of months, growth stocks have undergone a significant correction in valuations. The table below shows that the drawdown epicenter has been in the market's smaller capitalization/growth segments. Over half of the Russell 2000® Growth, and Nasdaq Composite have lost 40% or more of their capitalization vs. their 52-week highs.
Over this period, the iShares Software ETF (IGV), a proxy for high growth companies, has experienced a 20% decline in its trailing sales multiple. The MAST team believes a few factors are at play in the current correction: higher yields (both nominal and real), rotation towards value as the market prices Omicron leading to an endemic phase, and near-term decelerations in fundamentals. On the macro front, yields on the 10-Year treasury have increased from 1.40% to 1.75% since the end of November.
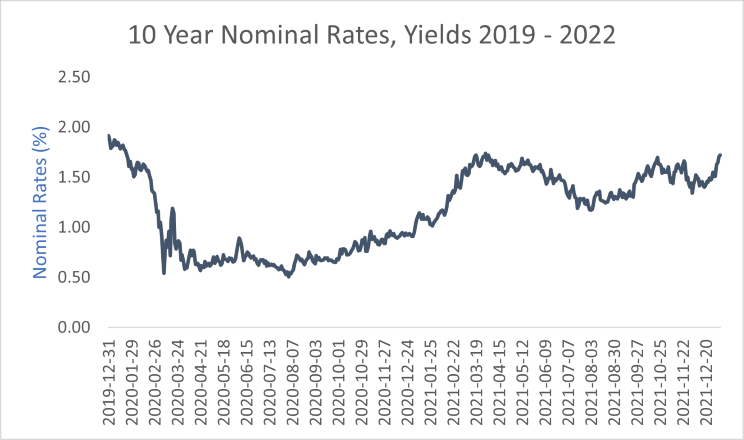
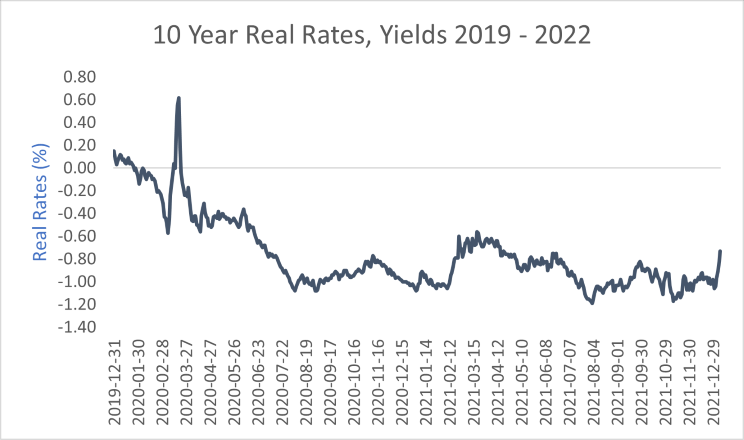
Source: Harbor Multi-Asset Solutions Team, Bloomberg
The move higher in yields is reflective of two things; firstly: the Federal Reserve’s hawkish pivot; secondly: the fading of the pandemic and the removal of the Covid 19 risk premia in bonds. To the first, inflation continuously surprised to the upside in the back half of last year. The Fed slowly started to acknowledge this reality: first, the dot plot shifted to an earlier liftoff, Powell retired the word “transitory”, the pace of tapering was accelerated, and - most recently - the conversation that it could be appropriate to start reducing the size of the balance sheet (QT). In addition to inflation remaining higher and more persistent, labor markets have recovered much quicker than anticipated and are now legitimately tight. The market responded in kind and is now pricing in three to four rate hikes this year and an additional three hikes next year, with the highest probability being that the first hike in the policy normalization process could come as early as March.
To the second, we believe bond markets have consistently priced a risk premium in bonds (lower yields) as a reflection of Covid 19 dampening economic activity longer term. As the Omicron variant is now well understood to be much less severe and highly contagious, it will likely spell the end of the pandemic phase of Covid 19 and usher us into an endemic phase which will limit the economic implications.
In addition to a more hawkish Fed and improvement in the Covid 19 backdrop, many of the higher growth names in the software space also started to disappoint relative to street expectations during third-quarter 2021 earnings. Many names in this space were beneficiaries of the pandemic as people hunkered down, and the home became everyone’s entertainment area, gym, and office.
This created difficult base effects. At the time, the analyst community began the narrative that digital adoption was being pulled forward but would continue to grow from more elevated levels.
For example, DocuSign, a software company that facilitates e-signatures on documents, sold off 40% when they reported 3Q21 earnings as they disappointed and guided lower on billings growth.
The streets' optimistic assumptions needed to be curtailed, resulting in negative estimate revisions. Because many of these stocks were priced for perfection, they did not have valuation support, and missing expectations further exacerbated multiple compression.
How much longer can this last?
As we’re seeing right now in the growth space, corrections are extremely painful for investors and require stepping back to see the whole picture.
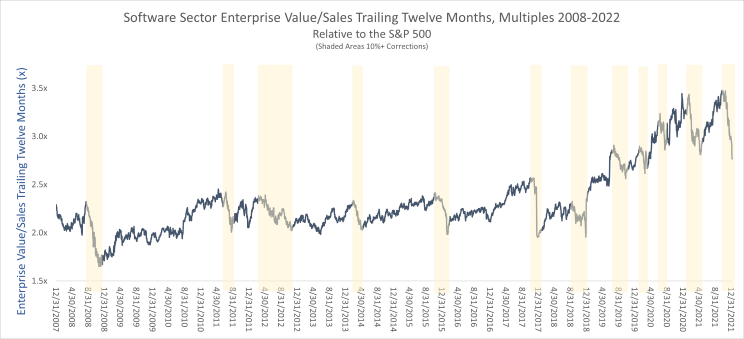
Source: Harbor Multi-Asset Solutions Team, FactSet
The chart above shows the Software sector's enterprise value to trailing sales relative to the market since the Great Financial Crisis. The highlighted areas are occurrences where valuation multiples corrected by 10% or more. The first observation of note is that material pullbacks in these growth sectors are not uncommon and occur frequently.
Additionally, we categorized each selloff into events driven by growth concerns, rising rates, or general uncertainty. We find that in macro-driven selloffs, either fear of rising rates or growth concerns, the average peak-to-trough drawdown is 16% and typically lasts for 11 weeks. The most recent pullback in sales multiples for the software sector has been 23% from the November peak, nine weeks ago.
Furthermore, when we step back and look at the forward returns from these drawdowns, we find that this growth sector produces a 3-year forward CAGR of 26% and outperforms the market by more than 10% per year following one of these draw down periods.
How much more downside risk?
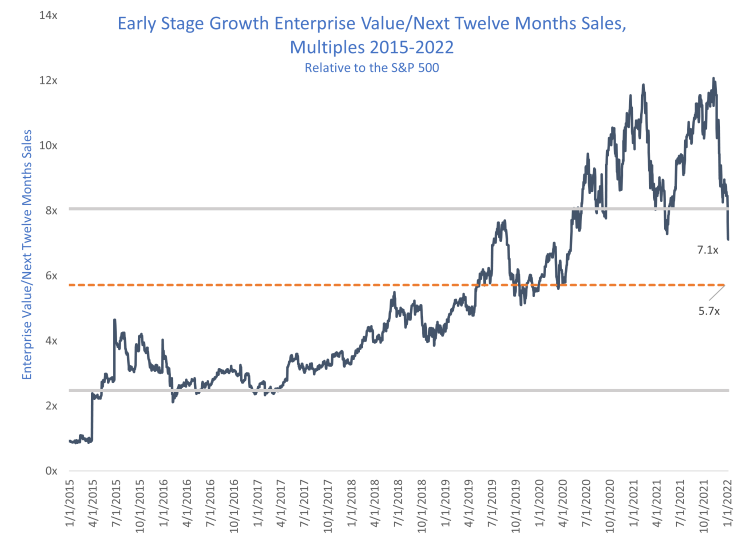
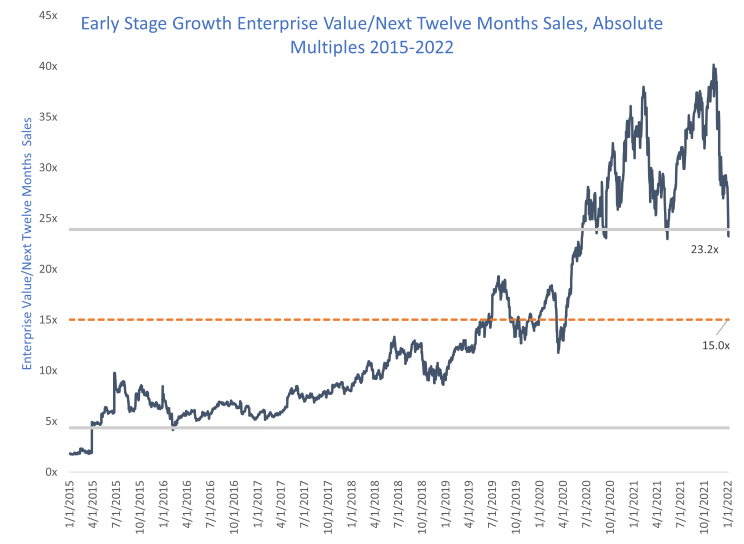
The fastest-growing, early-stage growth names have been at the center of the valuation correction. This basket of companies has excellent growth prospects, however, in the immediate term, are at higher risk due to a lack of profitability. The superior growth profile of these companies has meant historically they trade at a premium to the market on sales-based valuation metrics. Given the lack of earnings we find it most appropriate to value this group on an EV-to-Sales basis.
Source: As of January 6th, 2022, Harbor Multi-Asset Solutions Team, & FactSet
As seen in the above exhibit, before the pandemic, Early-Stage Growth companies traded at a 5.7x multiple to the S&P500. During the pandemic, multiples were propelled higher as real rates collapsed and business fundamentals benefited from adoption curves being pulled forward. These businesses were prime beneficiaries as organizations needed to function in a virtual world; demand for digitization of everything increased exponentially overnight. As a result, multiples expanded quickly and peaked out at a relative Enterprise Value/Next Twelve Months (EV/NTM) Sales multiple of 12x.
In 2021, the group experienced two valuation corrections. The first occurred early in 2021; vaccines began to be administered and there was a rotation out of Stay-at-Home baskets into more service-oriented areas that would gain from the reopening of the economy. This ultimately reversed as additional Covid 19 waves prevented the “re-opening” trade from sustaining.
The current correction started late in 2021; stocks began to react to the Fed's realization that inflation was higher and more persistent than expected, labor markets had recovered much faster than expected, and policy had to become more hawkish to avoid a rise in inflation expectations.
The MAST team has determined that pre-Covid 19 levels of relative sales multiples would be a reasonable trough level expectation. Early-Stage Growth companies multiples have corrected 40% to 7x, which is 0.5 standard deviations above ours through multiple assumption (2019 average level). Valuation on forward sales has become much less of a headwind.
Growth Multiples and Interest Rates
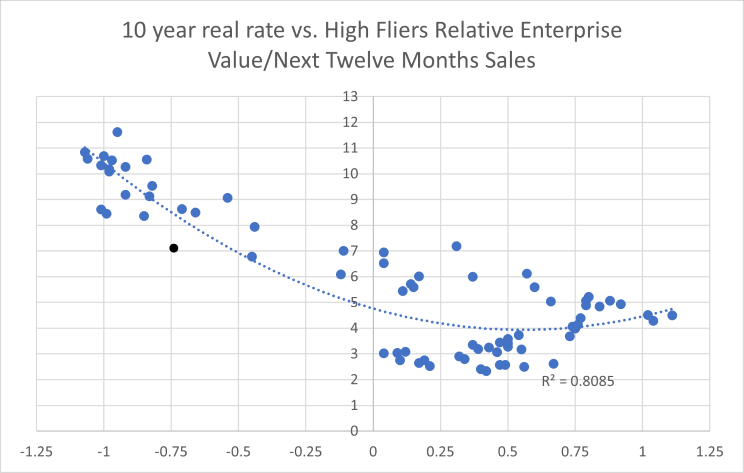
Growth stocks have greater sensitivity to changes in interest rates due to their long-duration nature of cash flows. Given the market representation of these stocks today, the market is therefore more rate sensitive relative to history. The chart below is a regression analysis looking at the sales multiples of early-stage growth companies relative to real rates.
First, note that the relationship is non-linear. When real rates are positive, there is no relationship. However, when real rates are negative, there is a very strong relationship whereby the more negative real rates are, the higher multiples go – this is exactly what happened in 2020. In the below chart, we are showing the relative EV/NTM sales multiple of these high-fliers vs. the market, and their multiple expansion vs. the market can be explained almost entirely by the negative real rate environment over 2020.
Source: Harbor Multi-Asset Solutions, Bloomberg
An additional highlight is that at the current sales multiple of 7x (black dot), the group is discounting real rates of -50bps (at time of analysis). The MAST team believes that real rates will likely move to a level of roughly - 30bps. Based on our target real rate assumption, the relative fair value multiple would be 6x, applying an additional 15% downside vs. the market from current levels.
Forward Return Prospects
Source: Harbor Multi-Asset Solutions Team, Jefferies and Visible Alpha
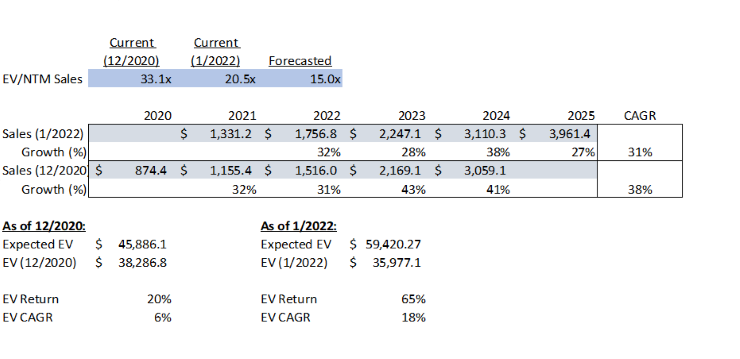
An IRR analysis of the early-stage growth companies shows that the forward return prospects have improved materially. In the exhibit below, we examined what the annual return prospects were for the group at the peak of the cycle versus today. When we look at the group today on an equally weighted basis and apply a 15x EV/NTM Sales fair value multiple on 2025 sales (average EV/Sales multiple over 2019), we expect a compounded annual growth rate of 17% over the next three years. This compares quite favorably to the 6% expected annual return at the end of 2020. Valuations got ahead of themselves over the last two years but have retreated to a much more favorable level.
What to do? Panic or Profit?
"Buy when there's blood in the streets, even if the blood is your own" – Baron Rothschild
Being invested in the innovation space has been painful for the last two months. Growth stocks have underperformed meaningfully, but we are starting to see opportunities. As shown above, significant corrections in valuations are not uncommon and have historically been a great time to invest in the space with attractive double-digit alpha over the following three years.
We continue to believe that disruption is a secular theme, the demand environment remains healthy, and valuations more compelling. Given the superior growth prospects and more attractive valuations we believe the current setup is favorable for forward returns.
Harbor at the Helm
Let’s assume there is further multiple compression as we head back to pre-Covid 19 EV/NTM Sales multiples and combine that with growth rates looking out over the next three years and see where that leaves us from a forward- looking IRR perspective. We believe these assumptions are reasonable, but they are assumptions, nonetheless.
We are not trying to call a bottom, but rather risk manage the probabilities. Even if we assume further multiple compression as higher real rates are digested, we think the valuation compression is limited from this point forward. Additionally, we believe contraction in multiples will be more than offset by the expected growth. The IRR analysis above shows that multiples could further de-rate by 5.5x turns or 25% to our pre-Covid 19 trough absolute multiple assumption. Despite that, the compounding effects of 30% sales growth, would imply an expected Enterprise Value for the group of $59,420M at year end 2025 (15x on 2025 sales) compared to
$36,205M today. That computes to a compounded annual growth rate of 18% over the next three years. We believe these returns can be realized as digitization will continue to gain market share from incumbents and believe that the distribution of outcomes in the innovation space is now skewed in our favor over a three-year holding period.
For more information, please access our website at www.harborcapital.com or contact us at 1-866-313-5549.
Legal Notices & Disclosures
The views expressed herein are those of Harbor Capital Advisors, Inc. investment professionals at the time the comments were made. They may not be reflective of their current opinions, are subject to change without prior notice, and should not be considered investment advice. The information provided in this presentation is for informational purposes only.
The Russell 1000® Growth Index is an unmanaged index generally representative of the U.S. market for larger capitalization growth stocks. The Standard & Poor's 500 Index is an unmanaged index generally representative of the U.S. market for large capitalization equities. These unmanaged indices do not reflect fees and expenses and are not available for direct investment. The Russell 1000® Growth Index and Russell® are trademarks of Frank Russell Company.
Performance data shown represents past performance and is no guarantee of future results.
Investing entails risks and there can be no assurance that any investment will achieve profits or avoid incurring losses.
Harbor Capital Advisors, Inc

Locate Your Harbor Consultant
INSTITUTIONAL INVESTORS ONLY: Please enter your zip code to locate an Investment Consultant.