


Harbor Small Cap Growth Fund’s Alpha Edge


Introduction
At Harbor, we have a long history of identifying and partnering with skilled active managers that bring expertise to specific areas of the investing landscape. One of those partners, Westfield Capital Management has been the manager for the Harbor Small Cap Growth Fund, HASGX, since November 2000, more than 21 years ago. Westfield Capital is a boutique firm, based in Boston, MA, that is solely focused on U.S. Growth investing, up and down the market capitalization spectrum. The firm’s approach relies on conducting in depth fundamental research on quality companies and philosophically adhering to a Growth at a Reasonable Price (GARP) approach, which we believe is particularly well suited for the U.S. small cap growth space. We believe that all of our investment partners possess competitive advantages that give them an “alpha edge” in producing results for clients, and below, we’ll explore some of the factors that we believe drive Westfield’s alpha edge in the small cap growth space.
The Small Cap Growth Landscape: A Particularly Volatile Space Where Quality Often Matters
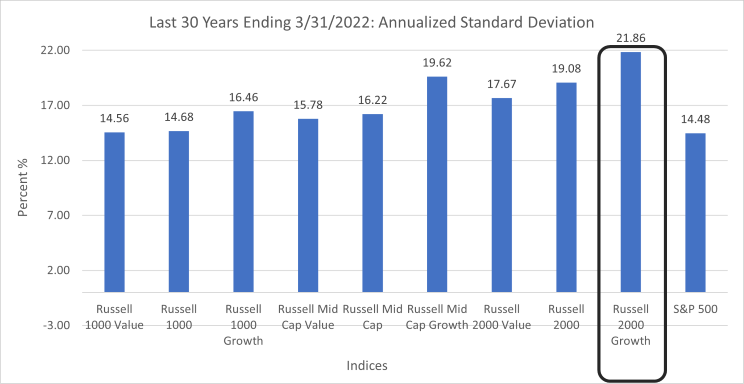
One of the ways to measure risk within an asset class or investment style is to look at the volatility profile of an established index that seeks to broadly track that space. Using that framework, the below chart highlights the annualized standard deviation over the last 30 years (ending 3/31/2022) of Russell indexes that cover the nine U.S. style boxes.
Source: Morningstar Direct, March 2022
One can clearly see that the small cap growth space overall (as shown by the Russell 2000® Growth index) has exhibited high levels of volatility; approximately 15% more volatile than the broad small cap index (Russell 2000®) as well as 11% and 33% more volatile than large and mid cap growth stocks (Russell 1000® Growth and Russell Mid Cap Growth).
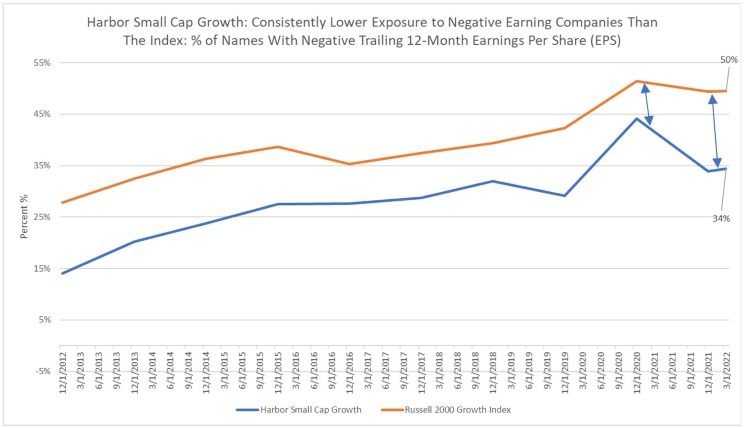
One of the reasons for this higher volatility profile is that the space contains many early-stage companies that exhibit quite a bit of volatility in their underlying business fundamentals as they mature. In fact, while this space features many promising companies with high levels of revenue growth, it also has chronically featured a high percentage of companies that generate negative earnings, either through temporary difficulties associated with their business or due to significant capital investment that is designed to drive future growth. The chart below highlights this fact and compares the percent of names held by the Harbor Small Cap Growth Fund, HASGX, with negative earnings over time vs that of the index. While the Russell 2000® Growth index has averaged 40% of constituents with negative earnings over time, the Harbor Small Cap Growth Fund has averaged significantly less at 29%. This has also consistently been the case since the fund’s inception and this gap has widened since the beginning of the pandemic, highlighting Westfield’s emphasis on quality and real earnings when selecting investments for the fund.
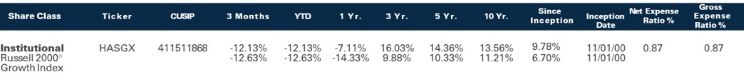
Average Annual Returns
Source: FactSet Research, March 2022
Performance data shown represents past performance and is no guarantee of future results. Past performance is net of management fees and expenses and reflects reinvested dividends and distributions. Past performance reflects the beneficial effect of any expense waivers or reimbursements, without which returns would have been lower. Investment returns and principal value will fluctuate and when redeemed may be worth more or less than their original cost. Returns for periods less than one year are not annualized. Current performance may be higher or lower and is available through the most recent month end on our website or by calling 800-422-1050.
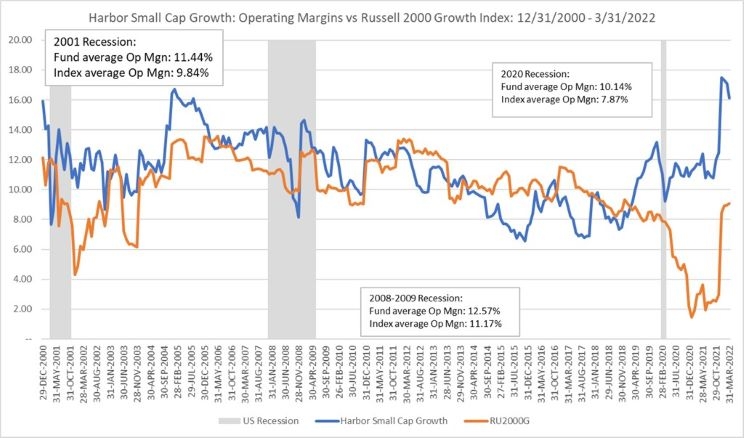
Another way to highlight Westfield’s bias towards quality is to look at the margins that companies are producing within both the fund and the index over time. The chart below purposefully looks at operating margins which allow for profitability comparisons of companies with both positive and negative earnings, whereas many other measures of profitability, like return on equity, may not account for the profitability of large numbers of companies within the index with negative earnings. As can be seen in Figure 3 below, the Harbor Small Cap Growth Fund, HASGX, has generated higher aggregate operating margins than the index 65% of the time since inception and, importantly, has also demonstrated superior margin stability during recessions, where company margins typically come under pressure, either from slowing demand, rising costs, or some combination of the two. The fund’s margins have continued to remain resilient compared to the benchmark during the 2021 economic rebound as well as in 2022 when economic growth has been decelerating and company margins are coming under pressure due to elevated levels of inflation.
Source: FactSet Research, March 2022
The combination of Westfield’s quality bias and ability to be selective among small cap companies within negative earnings has yielded favorable risk statistics vs. the benchmark since inception (lower standard deviation, beta, and down-capture ratio) as well as favorable excess and risk-adjusted returns vs. the index (return and alpha table below).
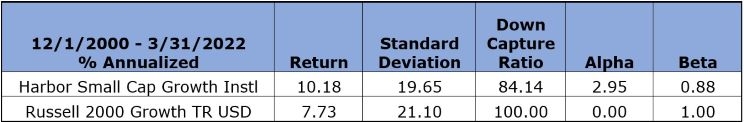
Source: Morningstar Direct, March 2022
Performance data shown represents past performance and is no guarantee of future results. Past performance is net of management fees and expenses and reflects reinvested dividends and distributions. Past performance reflects the beneficial effect of any expense waivers or reimbursements, without which returns would have been lower. Investment returns and principal value will fluctuate and when redeemed may be worth more or less than their original cost. Returns for periods less than one year are not annualized. Current performance may be higher or lower and is available through the most recent month end on our website or by calling 800-422-1050.
Skill Across an Important Area of the Small Cap Growth Landscape
In addition to being the most volatile area of the U.S. investment landscape as described above, the U.S. small cap growth universe is also fairly eclectic in its composition. For example, while not as concentrated from a sector weight standpoint vs. U.S. large cap growth, the small cap growth landscape features a high number of constituents within the Health Care Sector, and in particular, within the Biotech Industry (see table below).
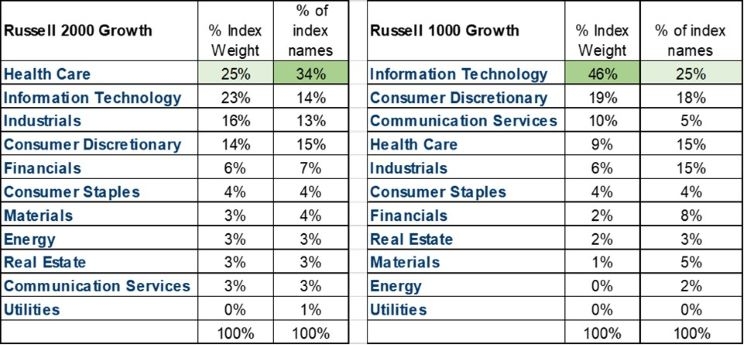
Source: FactSet Research, March 2022
Specifically, the Health Care sector within the Russell 2000® Growth index features 388 distinct companies, with 202 of these companies residing within the Biotech Industry group as of 3/31/2022. The innovation and resultant complexion impact that the Biotech industry has had on the small cap growth universe can’t be overstated. Just 10 calendar years ago at the end of 2011, there were only 234 Health Care names within the Russell 2000® Growth index, of which 59 resided in the Biotech industry. So, put another way, of the additional 154 HC names in the Russell 2000® Growth index today vs the end of 2011, 143 of those additional names represent publicly traded Biotech companies. This represents almost a 4-fold increase in just over a decade.
This sector /industry group has also featured very high dispersion of results, in part due to the binary nature of small cap pharmaceutical /biotech stocks where fortunes /failures are often dependent on emerging science and FDA drug approvals /denials. For example, for the five years ending 3/31/2022, while the Health Care sector within the Russell 2000® Growth index lagged the overall index (49.36% cumulative return vs 63.44% cumulative index return), there were 63 stocks that returned 200% or greater. Unfortunately, on the flip side of the coin, there were 167 stocks that returned -75% or worse over this time period.
In this area, Westfield has demonstrated particular skill as well as consistency across time, which we believe has been driven by the firm’s research structure, drive for continuous improvement (described in more detail below), as well as the experience and stability of the investment team. From a research structure, Westfield employs career sector analysts that each cover sectors/industries up and down the market capitalization spectrum, from small cap to large cap. This, in their view, gives them a more thorough view into a sector/industry’s overall ecosystem compared to many competitors who divide research coverage across market capitalization segments. In addition, Health Care is an area that has been very well resourced and stable over time from a personnel standpoint at Westfield, featuring 4 investment professionals with Health Care coverage responsibilities and/or backgrounds, averaging 22 years of industry experience. This includes Will Muggia, the firm’s President, CIO and CEO.
The chart below highlights Westfield’s stock selection skill across the Health Care sector over the last 10 years and one quarter (Positive stock selection in 7 of 10 calendar years). During this time, the fund’s Health Care names overall returned, on average, 447.35% on a cumulative basis, vs the index’s Health Care names which returned 255.56%, on average. In addition, the fund’s Biotech names returned 242.77%, on average, vs. 113.92% for the Index’s Biotech names. One of the ways that Westfield seeks to manage risk within the volatile Biotech space is by focusing on companies with more than one asset (drug/treatment), which potentially limits binary event risk as well as by not typically buying a company prior to phase two trials where proof of concept is less certain. Lastly, Westfield manages risk within this industry with smaller position sizes, which can gradually be sized up as companies move through trials and the team develops stronger conviction.
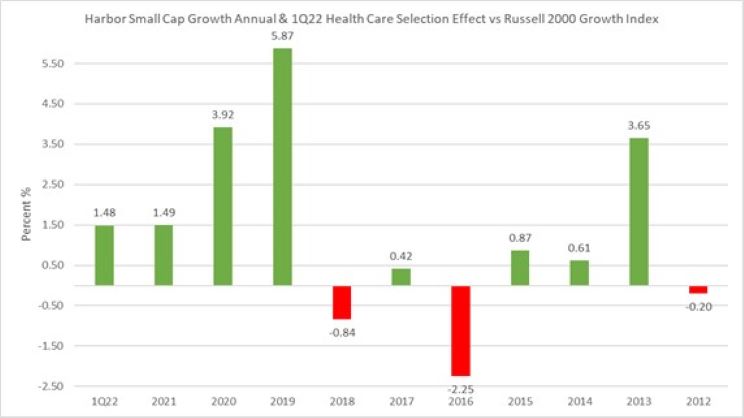
Source: FactSet Research, March 2022. Note: “Selection Effect” is the bias introduced when a methodology, respondent sample or analysis is biased toward a specific subset of a target population.
Performance data shown represents past performance and is no guarantee of future results. Past performance is net of management fees and expenses and reflects reinvested dividends and distributions. Past performance reflects the beneficial effect of any expense waivers or reimbursements, without which returns would have been lower. Investment returns and principal value will fluctuate and when redeemed may be worth more or less than their original cost. Returns for periods less than one year are not annualized. Current performance may be higher or lower and is available through the most recent month end on our website or by calling 800-422-1050.
Lastly, while this section has highlighted skill within Health Care, we’d be remiss to note that the team has also demonstrated skill across a wide range of sectors over the time, including positive selection in 8 of 10 sectors where the fund had exposure over the last 5 years ending 3/31/2022.
Continuous Improvement as a Means of Sustaining Westfield’s Alpha Edge
One of the key components that we look for when partnering with active investment partners is that they possess a culture of continuous improvement related to their investment approaches. Investment approaches encapsulate two elements, a firm’s investment philosophy and investment process. While we like to see consistency around investment philosophy, which represents a reflection around how a manager thinks about investing (and often acts as a north star regarding first principles), we like to see managers that are continuously looking to improve how they go about investing by seeking to improve their investment process. Process improvements can take many forms, such as a utilizing new analytical tools, data sets or valuation techniques. While sometimes difficult to measure, we find that firms that embrace continuous improvement tend to demonstrate high levels of humility, curiosity, and introspection.
In this regard, Westfield has shown a consistent commitment to continuous improvement that we’ve been able to observe over time. One specific example involves analyzing investment committee decision-making following periods of meaningful stock specific underperformance. Portfolios are managed on a consensus basis by an investment committee at Westfield that is comprised of the sector analysts as well as other senior members of the firm, such as Risk Manager, Rajat Babbar, COO and Strategist, John Montgomery, and Director of ESG Research, Paul McHugh. Historically, the firm has had a formal flag system that triggers increased committee scrutiny when a stock meaningfully underperforms the broad market, its industry group, or both. This process essentially requires the committee to address the causal factors driving the underperformance and either re-underwrite the position within the portfolio or trim or exit the position. That said, the commitment to continuous improvement occurred more than 5 years ago when the firm did a comprehensive analysis of committee decisions following periods of stock specific underperformance. As a result of this analysis, Westfield discovered that the committee was more often prone to inaction when these downside triggers were hit even though their ex-post attribution analysis showed that stocks hitting downside triggers had a tendency, on average, to continue falling in the future. As a result of this discovery, the committee has built in a bias toward action when downside triggers are hit, (either trimming/exiting a position, or adding on weakness), which they believe has been additive to their process over the last several years.
Another example around continuous improvement occurred around initial position weights set by the investment committee for new additions to the fund. Again, through a thorough objective analysis of analyst recommendations over time, including timing, efficacy, and initial position weight recommendations, Westfield discovered that certain analysts were behaviorally more aggressive than others in terms of their initial position weight recommendations, even after controlling for their level of conviction. Conversely, other analysts tended to wade in more conservatively with their recommendations even if their conviction levels were quite high. By discovering these behavioral biases at the individual level, the investment committee has been able to formally calibrate for this bias in how they now initially weight new buys in the portfolio.
Again, neither of these process improvements noted above fundamentally changed Westfield’s philosophy or even the overarching characteristics of the strategy, but they both represent incremental improvements that we believe have sustained Westfield’s alpha edge over time. We can even observe these improvements by evaluating outcomes, such as the fund’s rolling alpha over time, which has improved meaningfully over the last 10 years, vs the prior 10 years, as shown in the chart below.
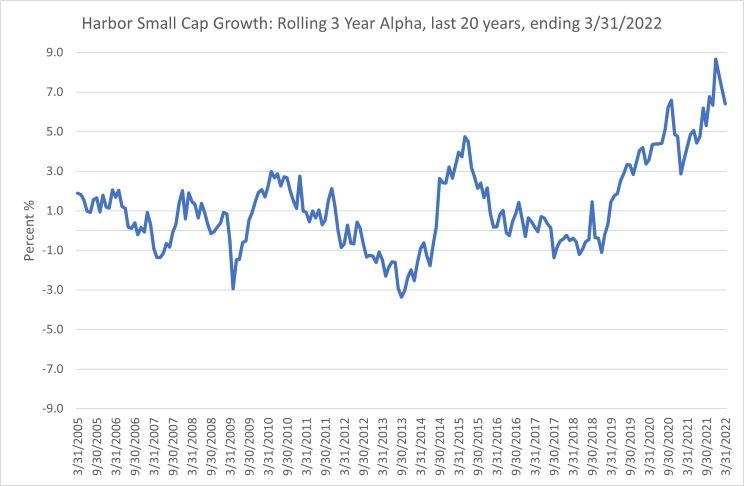
Source: Morningstar Direct, March 2022
Performance data shown represents past performance and is no guarantee of future results. Past performance is net of management fees and expenses and reflects reinvested dividends and distributions. Past performance reflects the beneficial effect of any expense waivers or reimbursements, without which returns would have been lower. Investment returns and principal value will fluctuate and when redeemed may be worth more or less than their original cost. Returns for periods less than one year are not annualized. Current performance may be higher or lower and is available through the most recent month end on our website or by calling 800-422-1050.
Consider the impact of an allocation to the Harbor Small Cap Growth Fund, HASGX, and how it may help you achieve you long term financial objectives.
Important Information
For Institutional Use Only. Not for Distribution to the Public.
Investors should carefully consider the investment objectives, risks, charges and expenses of a Harbor fund before investing. To obtain a summary prospectus or prospectus for this and other information, visit the website or call 800-422-1050. Read it carefully before investing.
The views expressed herein are those of Harbor Capital Advisors, Inc. investment professionals at the time the comments were made. They may not be reflective of their current opinions, are subject to change without prior notice, and should not be considered investment advice. The information provided in this presentation is for informational purposes only.
There is no guarantee that the investment objective of the Fund will be achieved. Stock markets are volatile and equity values can decline significantly in response to adverse issuer, political, regulatory, market and economic conditions. Stocks of small cap companies pose special risks, including possible illiquidity and greater price volatility than stocks of larger, more established companies.
This material does not constitute investment advice and should not be viewed as a current or past recommendation or a solicitation of an offer to buy or sell any securities or to adopt any investment strategy.
Investing entails risks and there can be no assurance that any investment will achieve profits or avoid incurring losses.
The Russell 1000® Growth Index is an unmanaged index generally representative of the U.S. market for larger capitalization growth stocks. This unmanaged index does not reflect fees and expenses and is not available for direct investment. The Russell 1000® Growth Index and Russell® are trademarks of Frank Russell Company.
The Russell 2000® Growth Index is an unmanaged index representing the smallest 2000 stocks with the highest price-to-book ratio and future earnings. This unmanaged index does not reflect fees and expenses and is not available for direct investment. The Russell 2000® Growth Index and Russell® are trademarks of Frank Russell Company.
Acadian Asset Management, LLC is a third-party subadvisor to the Harbor Overseas Fund.
Distributed by Harbor Funds Distributors, Inc.


Locate Your Harbor Consultant
INSTITUTIONAL INVESTORS ONLY: Please enter your zip code to locate an Investment Consultant.