


Mark R. Shenkman


Market Perspective, May 2021
The market liftoff continued in April as equity indices climbed to record heights. As the U.S. economy comes roaring back, driven by robust consumer spending and rising confidence, investors continue to assess the impact of a temporary supply-chain squeeze and a demand boom. A primary impediment to market momentum could be an overheating of the economy as a result of aggressive fiscal and monetary stimulus, which is fanning inflation and creating unsustainable growth expectations. With a super-cycle surge in commodity prices, inflationary forces may be unleashed. After 40 years of supply-side economics, investors have apparently accepted the prospect of big government with a significant shift to tax-and-spend Keynesian economic policies. So long as the Federal Reserve and Congress keep pumping trillions of dollars into the financial system, the Rocket Economy may continue, but a rocket’s upward trajectory relies on a huge amount of fuel and only lasts a limited amount of time.
There are two troublesome trends that need to be monitored closely as key indicators of a potential market correction. First, according to FINRA, total margin debt reached $822 billion at the end of the first quarter (after the collapse of Archegos), compared to $479 billion a year earlier, an increase of 72%. More importantly, margin debt now far exceeds the peak reached in 2007, just prior to the global financial crisis. With low yields, investors are turning more to margin and leverage to bolster returns on their invested capital.
Second, publicly held U.S. government debt is expected to pass 102% of GDP in 2021. This percentage of Federal debt would be the highest level since 1946, according to the Congressional Budget Office. Moreover, the U.S. annual deficit is projected to hit $2.3 trillion, or 10.3% of GDP, in FY-2021, the second-highest reading since 1945, only surpassed by last year’s historic peak of $3.1 trillion, or 14.9% of GDP.
As a result of low rates, last year’s interest payments on U.S. debt were only $345 billion, or 1.6% of GDP. Central banks, such as the Fed, may be hoping that higher inflation is ignited. A school of economic theory states that if inflation causes GDP to grow faster than the cost to borrow, a country can afford to carry more debt. However, if interest rates exceed GDP growth, it could represent a harbinger of difficult times.
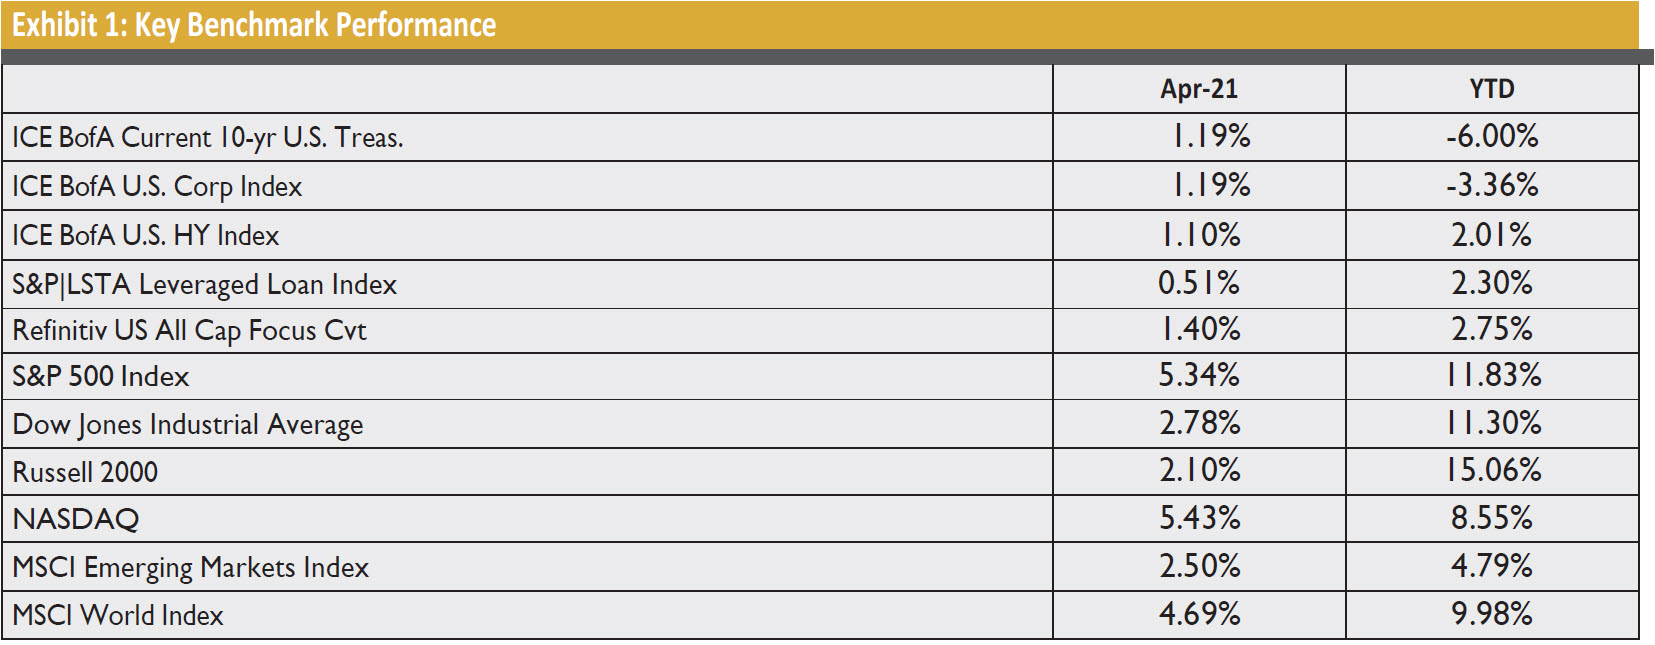
Exhibit 1 illustrates performance for various indices in April and YTD.
With the increasingly widespread reopening of the U.S. economy, GDP bounced back to a 6.4% annualized rate in the first quarter, following a gain of 4.3% in Q4. Personal consumption jumped by a 10.7% rate, the second-highest reading since the 1960s, in a sign that the biggest part of the economy remains vibrant.
Personal incomes of U.S. households surged by a record 21.1% in March, driven by a third pandemic-relief stimulus package, according to the Commerce Department. Spending also rose by 4.2% during the month, the largest increase since June.
According to JPMorgan CEO Jamie Dimon, U.S. consumers have $2 trillion more in their checking accounts than before COVID and are looking to spend. Deposits at the bank are up 24% in the year while total loans have declined 4%, further signs of the solid financial footing among U.S. consumers.
To further bolster the notion of pent-up demand, retail sales rose in March by 9.8%, the second-largest increase since tracking began in 1992, according to the Commerce Department.
New homes sales, which account for about 10% of U.S. home sales, surged in March to the highest level since 2006 following a seasonal winter slowdown. Purchases jumped 20.7% in the month to a 1.02 million annual rate. At this pace, the supply of new homes would sell out entirely in just 3.6 months. According to the National Association of Realtors, existing homes remained on the market for just 18 days in March, a record low.
The U.S. added 916,000 jobs in March, according to the Bureau of Labor Statistics, as leisure and hospitality, construction, and education hiring increased. Unemployment applications also decreased to the lowest level in 13 months. While certainly signs of positive momentum, there remain 8.4 million fewer jobs in the U.S. compared to February 2020, prior to the onset of COVID shutdowns.
The high yield market pushed higher in April as interest rate fears abated, corporate earnings beat expectations, and further re-opening momentum spurred investor confidence. The average of the five major high yield indices rose 1.09% in April, the highest monthly return for the asset class so far this year, bringing the year-to-date return to 2.16%.
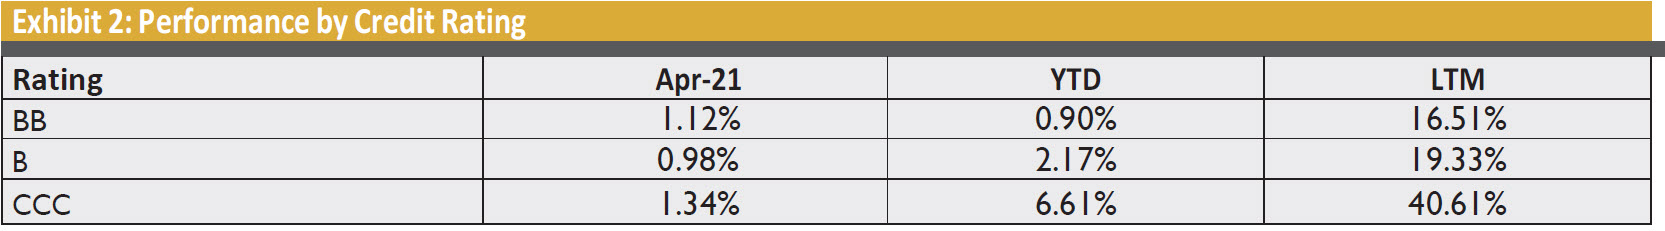
Performance by credit rating showed a modest bias toward lower-quality issues as CCC rated bonds edged out higher-rated credits during the month, according to the ICE BofA U.S. High Yield Index (H0A0). On a year-to-date basis, CCC’s have easily outpaced higher quality credits.
Exhibit 2 highlights performance by rating for the H0A0. CCC’s also hit an all-time low yield of 6.85% on April 8th as investors continued to seek higher yields in a low default environment.
New issuance in the high yield bond market totaled the highest April volume on record as $49.4 billion came to market in 75 transactions. Year-to-date issuance of $208.0 billion represents a 90% increase compared to the same period last year, according to JPMorgan Research.
The leveraged loan market underperformed high yield bonds in April as interest rates receded modestly from a one-year high, giving pause to the rate-rush into floating rate asset classes. The S&P|LSTA Leveraged Loan Index rose 0.51% in April, bringing the year-to-date return to 2.30%.
Leveraged loan issuance declined modestly in April with $74.4 billion coming to market in 110 deals, though net issuance of $44.6 billion was the second highest monthly net volume total on record. Year-to-date gross and net issuance of $375.8 billion and $117.8 billion are up 82% and 116%, respectively, versus the same period in 2020.
New CLO formations, which are a major driver in the loan markets, have been robust in recent months. Following a record month in March, 85 U.S. CLOs priced in April totaling $36.3 billion, according to JPMorgan Research, the third-highest monthly total on record. Year-to-date, 319 U.S. CLOs have priced for $142.6 billion.
Today’s booming economy is different than past recoveries. Last year’s recession was induced by pandemic-driven government mandates, which artificially suppressed supply and demand. While the markets are continuing to propel forward, questions investors should consider are: How long will the boom last? How will consumer behavior change? How much inflation will occur? How will higher taxes impact corporate profits? How quickly will employment recover? The answers to these questions should determine the direction of the markets.
Investors will need to cope with the five H’s: higher interest rates, higher commodity prices, higher taxes (particularly capital gains), higher inflation, and higher government spending. Does this formula bode well for higher markets?
Although the U.S. economy is rocketing upward, and the markets are enjoying the ride, serious clouds appear on the horizon. Even rockets soaring in the stratosphere do not rise indefinitely. Major concerns that could stall the recovery include: higher interest rates, which seem inevitable as the U.S. will need to borrow $1.3 trillion over just the next two months (excluding new infrastructure appropriations); the sprouting seeds of inflation (i.e. used car prices have soared 50% year-over-year); and higher commodity costs amid material shortages and difficulty in finding workers, which may cause runaway inflation.
The Fed may deem inflation as “transitory,” but the dynamics of inflation may imperil the economy as global companies pass along rising costs. This time is no different than past inflationary cycles. Once inflation becomes imbedded, the Fed’s actions could be consequential. Even the slightest tapering by the Fed could result in a tantrum, which may not be priced into current market valuations.
Legal Notices & Disclosures
All charts and data are for illustrative purposes only.
Views expressed herein are drawn from commentary provided to Harbor by the subadviser, Shenkman Capital Management, Inc., and may not be reflective of their current opinions or future actions, are subject to change without prior notice, and should not be considered investment advice. The information provided in this presentation is for informational purposes only.
The information provided in this article should not be considered as a recommendation to purchase or sell a particular security. The weightings, holdings, industries, sectors, and countries mentioned may change at any time and may not represent current or future investments. Performance data shown represents past performance and is no guarantee of future results.
Shenkman Capital Management, Inc. is an independent subadviser to the Harbor High-Yield Bond Fund and the Harbor Convertible Securities Fund.
*Redistributed with Shenkman permission.
For Institutional Use Only. Not for Distribution to the Public.

INSTITUTIONAL INVESTORS ONLY: Please enter your zip code to locate an Investment Consultant.


